The Illinois General Assembly and Governor Pritzker just gave community college districts in Illinois the authority to work with local housing authorities to develop affordable housing. The bill, HB0374, takes effect January 1, 2022. The text is very short (see the screenshot below or read the bill).
What does this mean for community college districts? It probably means that they can lease their land to the local housing authority for that local housing authority to develop affordable housing for the community college’s students and their families.
The land is essentially free, since it’s already owned by the community college districts and it’s not taxed. Plus, community college districts have their own taxing authority (subject to caps) that can be used to pay for bond-based debt.
Three opportunities in Chicago
I’m going to point out three community college locations in Chicago that could be great places for new and affordable student housing to be built.
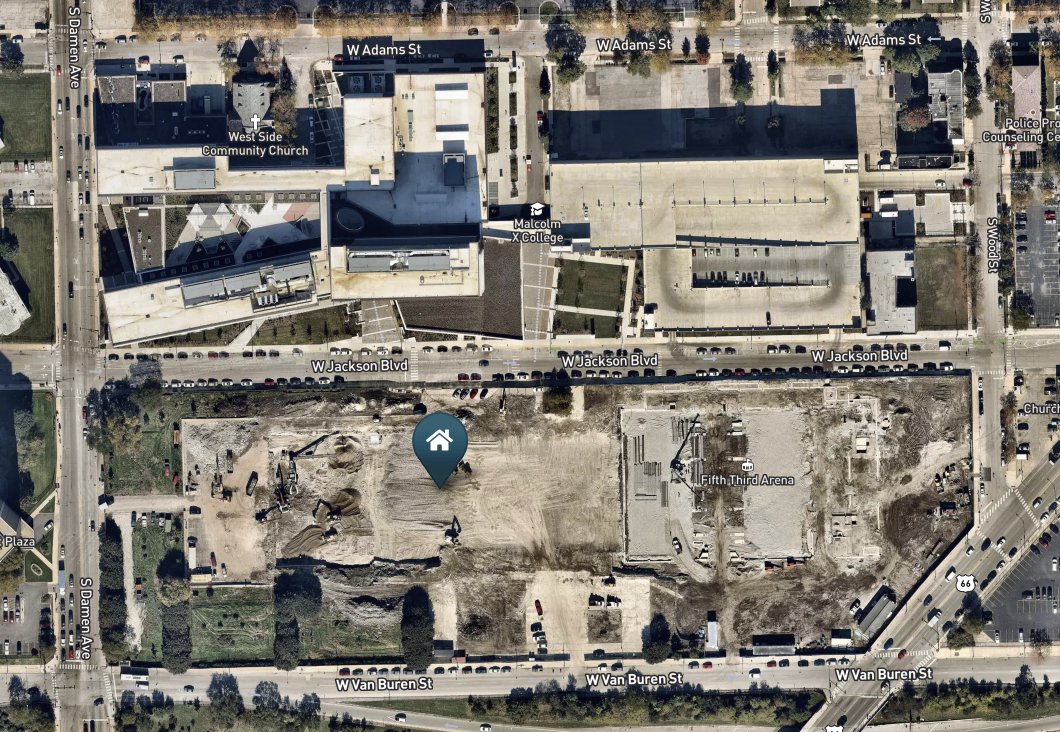
Malcolm X College
Across from the New Malcolm X college was the original Malcolm X college, and now it’s a huge vacant lot. The Community Colleges of Chicago sold it in 2016 to the City of Chicago, which sold it in 2017 to Rush University Hospital System (which is across the Eisenhower Expressway to the south).
The land across from the New Malcolm X college has been vacant for half a decade.
Welp, Rush also wants to build housing – for unhoused people who use emergency rooms as a way to live and be housed. (People’s health dramatically improves when they have permanent housing and hospitals spend less money on treating them in expensive-to-operate ERs.) Rush and the Chicago Housing Authority could develop housing for both populations – the chronically sick and students – using funds combined with the Chicago community college district.
Additionally, the Jackson bus takes people to and from downtown, and the Blue Line has a station at Illinois Medical District a block away.
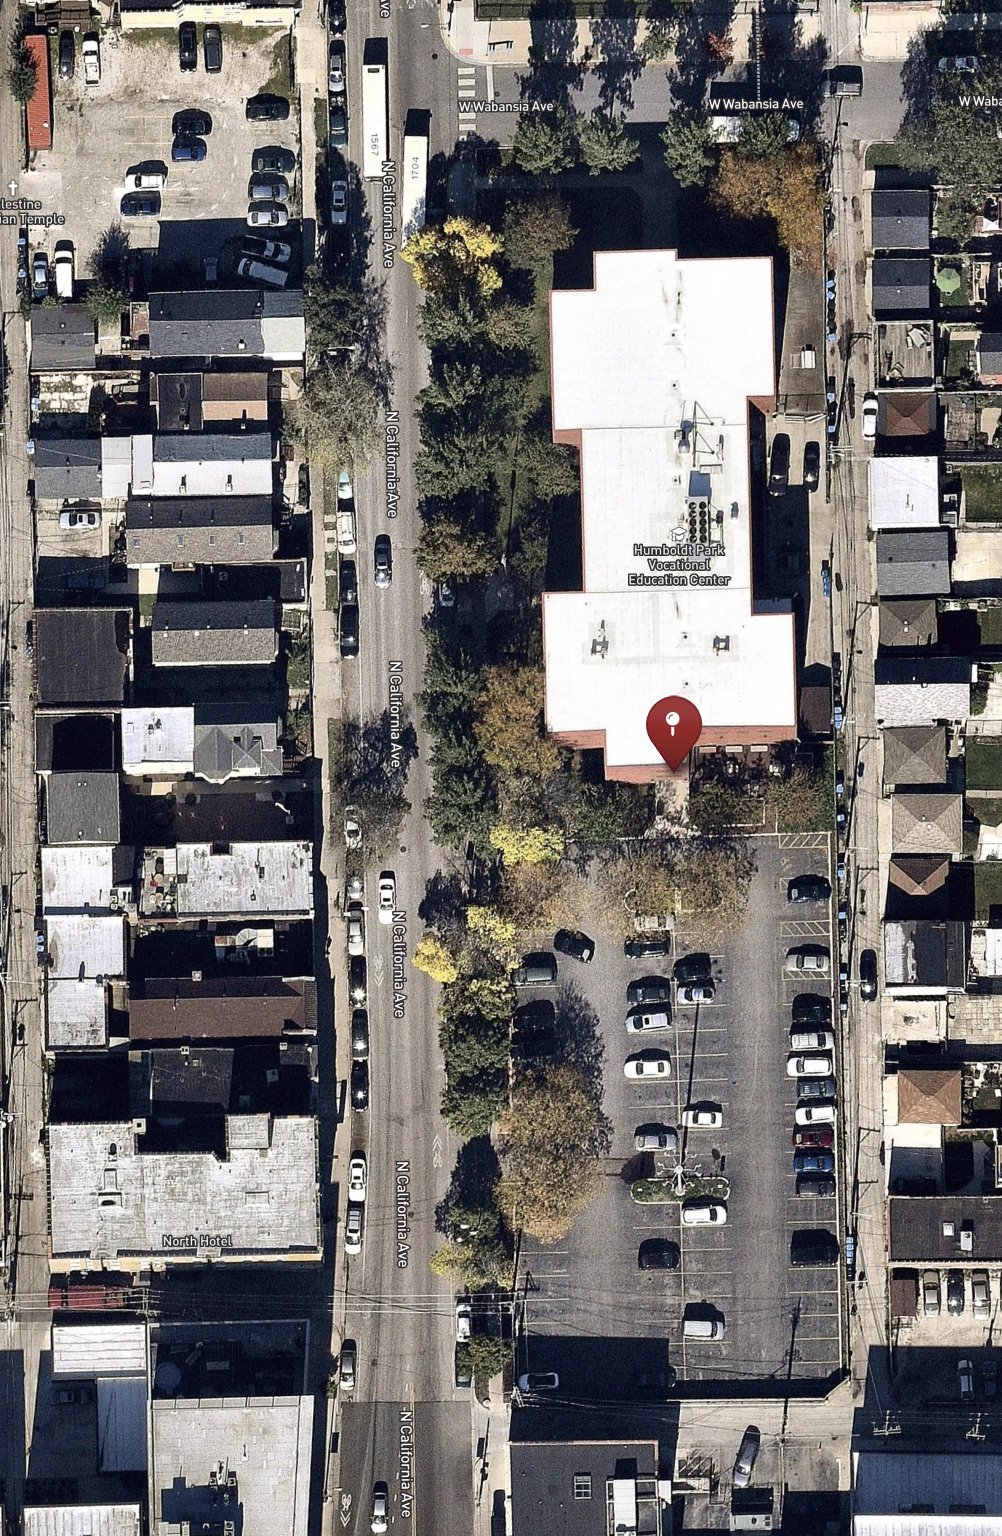
Humboldt Park
The Humboldt Park Vocational Education Center, which is operated by the Wilbur Wright community college, is another prime location for student housing. The center has a huge parking lot and lies along the California Avenue and North Avenue bus routes.
Humboldt Park Vocational Education Center and its parking lot, which takes up more area than the building.
Parking lots love to be turned into homes, especially in gentrifying areas. That’s free land in a high-demand area where rent is north of $1,200 for a 1-bedroom apartment (I’m using HUD’s Fair Market Rent for the 60647 ZIP code).
Dawson Technical Institute
Then there’s Dawson Technical Institute in Bronzeville, which is about 2 blocks from the Indiana Green Line station and several east-west and north-south bus routes.
Dawson also has a massive parking lot, on the opposite side of the Green Line tracks from the building on State Street.
Dawson teaches construction trades, which is perfect because the Green Line can take students to internships and jobs at all of the new construction in Fulton Market that’s ongoing and going to continue for the next three years (at a minimum).
What other good affordable student housing construction opportunities do community colleges in Illinois have?
After the bill drama with Peoples Gas last year, in which I was billed a $50 “base” fee per unit per month for the privilege of having a gas line to my house, I decided to make the gut rehab of my two flat all electric. I think that making an all electric house is easy, but it takes a lot of research to know what that means and how to select materials and appliances.
I have several reasons for keeping natural gas out of my house:
Natural gas has point source emissions causing indoor air pollution that need to be vented and evacuated properly (gas stovetops emit methane into your kitchen, so turn on your hood that hopefully vents to the outside)
The price of natural gas is not falling as fast as electricity is falling
Electricity is more and more likely to come from renewable sources, especially in Illinois because of our state policies that require ComEd and Ameren to buy more and more power from renewable sources
A future photovoltaic solar panel array could be integrated and some of the electricity in the house would come from its own generator
Without gas pipes in the house, there is less infrastructure to build and maintain
Climate change is continuing to make life harder for the world’s inhabitants and electrical heating & cooling causes less fossil fuel emissions (“An electrified home uses 8,333 more kWh annually than a gas (or propane) home but displaces 96 million BTU of fossil fuel use.”Elevate+Rocky Mountain Institute study)
There are still some downsides to having an all electric house, namely when the power goes out on the block then nothing in the house will turn on. There are solutions, for this, though, including integrating a battery pack or using a fossil fuel-powered generator with its own tank.
The Passivhaus-certified single-family house in Hyde Park that I toured in 2018 has a small natural gas-powered generator in the rear yard, fueled by a typical Peoples Gas supply line.
What does it mean to have an electric house?
I think there are three categories of choices that one makes, about visible appliances, invisible appliances, and heating & cooling.
A visible appliance is one you use directly and frequently, like an oven and a clothes dryer. These are essentially the only two appliances that have gas and electric versions and electric versions are just as commonly available as gas version.
An invisible appliance is one that’s in a closet or in the basement, like a water heater. Most people I know have a gas-powered water heater (usually a tank, not tankless), and there are two kinds of electric water heaters (which I detailed in Two-flat journal 3). Again, these are very common and electric water heaters (standard with resistance heating, tankless, and hybrid heat pump) can be picked up anywhere a gas-powered water heat can be purchased.
Think of a heat pump as a “reversible air conditioner”: an air conditioner removes heat in the air of a space and puts it outside, while a heat pump “removes” the heat in the air of the outside and puts it inside.
Heating & cooling is the complicated category of the three. A typical new construction house or condo has gas forced air for heating, a condenser for air conditioning, and the air is pushed through the house via ducts. In the electric universe, however, mini splits/air source heat pumps have been around for 40 years and are extremely efficient at both heating and cooling. In cold climate region 5, where Chicago is, air source heat pump manufacturers have additional products to deal with the extreme cold temperatures.
Going electric in the heating and cooling category is the only one that necessitates deeper research on windows, wall assembly, and insulation to go beyond the basic energy efficiency code (Illinois Energy Conservation Code 2018). While the air source heat pump is efficient (some have a coefficient of performance, COP, of 3-4, meaning it transfers three to four times as much heat energy to the house as the energy they consume) it will work very hard to keep a house warm during negative temperature days (F°) and thus it’s important to have a well-sealed house so the conditioned air you’re paying for doesn’t escape.
If you want your house to be all electric, a lot of these choices can be made over time. For example, you can stop the air pollution by buying a range with an induction cooktop, which is extremely efficient, safe for households with children, and very easy to clean. I like to cook soup in my Dutch oven (which is compatible with induction cooktop) and I would rather not have to have the burner on for an hour, accompanied by a noisy vent fan.
Financial benefits of an all electric house
In addition to certain federal tax credits for replacing certain appliances, which you can claim when you file your tax return, there are often local incentives. ComEd has a new Electric Homes program that offers $4,000 cash (to the builder or general contractor) for an electric house (new construction or renovation) that meets their requirements. (2021 is the second year in operation, and there’s no guarantee it will operate next year.)
From ComEd’s marketing:
Building your clients’ dream homes – why not make them energy efficient?
ComEd provides a $2,000 incentive per home for electric homes new construction! All-electric home construction can sound daunting at first, but with the knowledge and help of ComEd, you too can benefit from tight envelope, all-electric HVAC, heat pump water heating, lighting and appliances. Construction of single-family homes, duplexes, townhomes, and 2-4 flats are eligible.
Make the jump to high-quality, next-generation, electric homes. Reduce energy bills while providing superior comfort. Prepare for a clean, resilient energy future.
Learn about additional clean energy strategies like solar power, electric vehicle charging, smart homes and induction cooking.
I’ve done a lot of research on appliances in all three categories because my architect needs to know exactly which appliances I’m selecting so the kitchen, utility closet, basement, and other spaces can be designed to fit them. Thankfully, a lot of appliances have similar dimensions so it’s easy to match the available space with the catalog of laundry machines, refrigerators, etc.
My architect and I reviewed a printed set of plans last week, mainly so he could alternate between drawing on AutoCAD and marking up issues.
There are two main attributes to watch for when selecting electric appliances: the yellow Energy Guide label that estimates the annual cost of operating the appliance, and whether it has Energy Star certification. One of the ComEd Electric Homes requirement is that every appliance that can be Energy Star certified is – I’ve found that there are no certified ranges.
My favorite place to shop for appliances online is Abt. When I polled my Twitter followers last summer for appliance store recommendations, Abt was overwhelmingly the most recommended store.
Note: I have no idea which ones will be in stock when it comes time for me to buy any of them, but these are the ones I would pick right now.
All appliances and equipment are Energy Star-certified except where noted.
Visible appliances
Dishwasher. I’ve got three options on my list (each costs less than $500):
Frigidaire FCRE3052AB ($629) – Not Energy Star certified, not induction
Frigidaire GCRI3058SS ($1,169) – Not Energy Star certified, yes induction
Invisible appliances
Water heater. Something to know about tankless is that it’s not necessary to have a single tankless source for the whole house, as it’s possible to have multiple tankless water heaters at each water source, sized to the need – the kitchen sink can have one, and the shower and the lavatory can share another. The hybrid heat pump water heater currently has a 10% federal tax credit, up to $300.
Rheem brand’s “Performance Platinum 40 Gal. 10-Year Hybrid High Efficiency Smart Tank Electric Water Heater” (Home Depot)
Each dwelling unit will have the same water heater but may not have the same kitchen and laundry appliances.
Clothes washer. Stacked, to save space, from (each is about $800):
Mini split systems have two parts: An outdoor condensing unit and one or more indoor fan units. They’re connected by a refrigerant line, an outgoing condensation line, and electricity from the outdoor unit to the indoor units that is routed through a small diameter (3″) hole in the exterior wall.
Three larger-capacity heat pumps on the roof of a new construction and all-electric three-flat in Pilsen. Photo: Steven Vance.
There are several options for indoor units: Wall-mounted, ceiling mounted cassette, ceiling mounted box, and ducted (the outdoor unit will provide the hot or cold refrigerant and the ducted unit will blow air through a duct network). My architect and I have selected two ceiling-mounted cassettes per dwelling unit; these fit within the 16″ between joists and avoids the protrusion of wall-mounted units.
Outdoor unit, Mitsubishi MXZ-3C30NAHZ2 (Ecomfort, $3,365 x2)
Ceiling cassette indoor unit, Mitsubishi MLZ-KP09NA (Ecomfort, $895 x4)
I will need a venting system to exchange fresh air into each dwelling unit, without relying on the typical situation where the leakiness of houses brings in fresh air. An energy efficient way to do this is to use an “energy recovery ventilator” (ERV) that transfers the heat or chill of outgoing conditioned air to incoming fresh air to reduce the amount of energy that the heat pump would expend to warm or chill the incoming air.
An alternative to ducted ERVs is to use a wall-mounted model, such as the Zehnder ComfoAir 70 ventilation unit, Holtop ERVQ-B150-1A1F, or Blauberg VENTO Expert A50-1 W (that’s on Blauberg’s German-market website, and that company has a subsidiary called VENTS that has an American-market website). There’s also Panasonic’s WhisperComfort ($420) that can be mounted on the wall or ceiling. However, I need to verify that either has air moving capacity required by the indoor air quality standard ASHRAE 62.2, specified in the ComEd Electric Homes program. It might be possible to use two of these, including one in the bathroom.
What’s missing
Oh, one more thing, the electrical panels in the basement will need to be replaced (which is part of the replacement of the entire electrical system), and ComEd will likely need to string higher-amperage lines from the alley overhead power lines to the house. This area requires more research and possible a conversation with an electrical contractor or ComEd. I’m currently assuming that I can specify that the electrical contractor will handle this with ComEd.
In order to get the two-flat ready for a gut rehab, one has to gut it.
The rehab stage is still months away, as my architect and I continue to develop plans. He does most of the work, but it’s quite collaborative because there are layout, design, and finishing choices that we need to make.
Gutting the house is also necessary for the plans because my architect needs to know what’s behind the walls.
I hired Amplify Property Solutions for the job. APS has a social mission of training and employing young Black men. You can ask me personally how much it cost, but it was between $5,000 and $10,000 (that range includes the cost of six Dumpsters).
I am very happy with the crew’s work and Ron and Ted’s dedication to communication, clarity, and customer service. The work took a week longer than they predicted because of some aspects that I think were next to impossible to know:
There were 1-2 “extra” layers of flooring in some places. From top to bottom in the upstairs living room there were carpet, wood, linoleum, wood, and subfloor layers.
Because the center beam in the basement has been failing (sagging) for years, the centers of each floor were sinking making the floors unlevel. Platforms were built in each kitchen to raise and level the floor.
The house is one of two row houses, so one exterior wall is shared. On this wall, behind the drywall was a 1″ layer of plaster that took awhile to chip away.
The subfloor boards are very wide and old growth and original (so they’re at least 130 years old). I’ve been told that some people find these valuable; if you’re interested in purchasing them, please get in touch!
With this level of demolition, a permit is required! I pulled an easy permit for this project (which I think cost $375). The Dumpster company obtained their own permits to occupy the street right of way.
Also, as a way for the Chicago Department of Buildings to discourage gut rehabs being permitted with a series of easy permits, when a Standard Plan Review is most likely required, the DOB required that I apply for a renovation/alteration permit and show them in-progress drawings.
Consultants and contractors used so far
Susannah Ribstein, represented by Living Room Realty – My patient and understanding real estate agent
Amplify Property Solutions – Demolition crew. Contact Ted Christians: Call or text 773-433-0939, email TChristians@theacademygroup.com
The demolition exposed the shape of the chimney. The right side was filled in and the wall was flat so we didn’t know how wide the chimney was.
The kitchen platform had a level top, but the floor beneath was uneven. The framing underneath the platform had angles cut to ensure the platform was level.
Maps have been used to devalue neighborhoods and to excuse disinvestment. There should be maps, and narratives, to “greenline” – raise up – Chicago neighborhoods.
The Home Owners’ Loan Corporation “residential lending security” maps marked areas based on prejudicial characteristics and some objective traits of neighborhoods to assess the home mortgage lending risk. (View the Cook County maps.) The red and yellow areas have suffered almost continuously since the 1930s, and it could be based on the marking of these neighborhoods as red or yellow (there is some debate about the maps’ real effects).
The Home Owners’ Loan Corporation and its local consultants (brokers and appraisers, mostly) outlined areas and labeled them according to objective and subjective & prejudicial criteria in the 1930s. Each area is accompanied by a data sheet and narrative description. The image is a screenshot of the maps as hosted and presented on Chicago Cityscape.
The idea of “greenlining”
I might be thinking myopically, but what would happen if we marked *every* neighborhood in green, and talked about their strengths, and any historical and current disinvestment – actions that contribute to people’s distressed conditions today?
One aspect of this is a form of affirmative marketing – advertising yourself, telling your own story, in a more positive way than others have heard about you in the past.
In 1940, one area on the Far West Side of Chicago, in the Austin community area, was described as “Definitely Declining”, a “C” grade, like this:
This area is bounded on the north by Lake St., on the south by Columbus Park, and on the west by the neighboring village of Oak Park. The terrain is flat and the area is about 100% built up. There is heavy traffic along Lake St., Washington Blvd. Madison St., Austin Ave. (the western boundary) and Central Ave. (the eastern boundary).
High schools, grammar schools, and churches are convenient. Residents shop at fine shopping center in Oak Park. There are also numerouss small stores along Lake St., and along Madison St. There are many large apartment buildings along the boulevards above mentioned, and these are largely occupied by Hebrew tenants. As a whole the area would probably be 20-25% Jewish.
Some of this migration is coming from Lawndale and from the southwest side of Chicago. Land values are quite high due to the fact that the area is zoned for apartment buildings. This penalizes single family occupancy because of high taxes based on exclusive land values, which are from $60-80 a front foot, altho one authority estimates them at $100 a front foot. An example of this is shown where HOLC had a house on Mason St. exposed for sale over a (over) period of two years at prices beginning at $6,000 and going down to $4,500. it was finally sold for $3,800. The land alone is taxed based on a valuation exceeding that amount. This area is favored by good transportation and by proximity to a good Catholic Church and parochial school.
There are a few scattered two flats in which units rent for about $55. Columbus Park on the south affords exceptional recreational advantages. The Hawthorne Building & Loan, Bell Savings Building & Loan, and Prairie State Bank have loaned in this area, without the FHA insurance provision. The amounts are stated to be up to 50% and in some cases 60%, of current appraisals.
Age, slow infiltration, and rather indifferent maintenance have been considered in grading this area “C”.
Infiltration is a coded reference to people of color, and Jews.
My questions about how to “greenline” a neighborhood
How would you describe this part of Austin today to stand up for the neighborhood and its residents, the actions taken against them over decades, and work to repair these?
How do you change the mindset of investors (both small and large, local and far) to see the advantages in every neighborhood rather than rely on money metrics?
What other kinds of data can investors use in their pro formas to find the positive outlook?
What would these areas look like today if they received the same level of investment (per square mile, per student, per resident, per road mile) as green and blue areas? How great was the level of disinvestment from 1940-2018?
In the midst of writing this, Paola Aguirre pointed me to another kind of greenlining that’s been proposed in St. Louis. A new anti-segregation report from For the Sake of All recommended a “Greenlining Fund” that would pay to cover the gap between what the bank is appraising a house for and what the sales price is for a house, so that more renters and Black families can buy a house in their neighborhoods.
That “greenlining” is a more direct response to the outcome of redlining: It was harder to get a mortgage in a red area. My idea of greenlining is to come up with ways to say to convince people who have a hard time believing there are qualities worth investing in that there they are people and places worth investing in.
The Digital Scholarship Lab at the University of Richmond digitized the HOLC maps and published them on their Mapping Inequality website as well as provided the GIS data under a Creative Commons license.
This is the ordinance that says residential developments have to provide 0.5 car parking spaces per home, and that the minimum home size can be smaller.
How many units? At least 1,500. Here’re the 19 buildings I know about that are being built within 600 and 1,200 feet* of a Chicago Transit Authority ‘L’ station – the only areas, essentially, where multi-family housing can be developed.
Why can’t dense housing be built elsewhere? Because the most desirable living areas in Chicago – along retail streets in Logan Square, North Center, Lincoln Park, Lakeview, and West Town – are zoned for single-family use. (And ad-hoc zoning districts taking the place of community land use planning.)
How do I know popular neighborhoods are zoned for single-family use? Because Daniel Hertz’s new Simplified Chicago Zoning Map makes it easy to see. Yep, even along those dense business districts and even outside the train stations.
Do the single-family home zones contain single-family homes now? Absolutely not! Much of the buildings in areas zoned for single-family homes have everything but! The particular view of the map that Hertz uses in his blog post shows that even adjacent to CTA stations, and within 1 block, there are only single-family zones (in red). There are many multi-family buildings in these red zones.
Red areas are zoned for single-family homes only. View the map.
What ends up happening there? Teardowns. And the Lakeview Chamber of Commerce finds believes that non-matching zoning – it matches neither the existing uses nor the needs for the neighborhood – and teardowns are going to cut into consumer spending on its lively retail streets. Lakeview is seeing a population change to families which tend to have less disposable income.
More housing in a popular neighborhood means more shoppers, more property taxes, more “boots on the ground”, more “pedestrian congestion” in front of our local businesses.
Doesn’t the ordinance make station-adjacent parcels friendly to multi-family housing because of the TOD ordinance? Yes, and no. As Hertz points out, “virtually every sizable development involves a zoning variance or planned development process that goes beyond the zoning you’ll see on the map”.
The TOD ordinance is 19 months old and working exactly as intended, building more housing next to train stations, and giving more people the opportunity to have access to affordable transportation. So it needs an upgrade to be able to do more. Since, in Chicago, zoning is our land use plan, we need the best kind of zoning rules and this is one of the best.
Imagine what the TOD ordinance could do if it were expanded. Think, making the parking requirement relief and allowing different unit sizes by-right instead of going through an arduous and expensive zoning change process. Then, expanding the rule to include more than just 600 feet (which is less than a block) from a train station – people walk several blocks to get to CTA stations, and bike even more. And, beefing up the affordable housing requirements.
Let’s do this, Commissioner Andrew Mooney. Let’s do this, housing advocates. Let’s do this, transit advocates. I’m looking at you, Latin United Community Housing Association (LUCHA), Logan Square Neighborhood Association (LSNA), We Are/Somos Logan Square, Pilsen Alliance, Metropolitan Planning Council (MPC), Active Transportation Alliance, and the Center for Neighborhood Technology (CNT).
* The distance depends on existing Pedestrian Street zoning. If the property is on a designated Pedestrian Street then the station can be up to 1,200 for the ordinance to apply, double the normal 600 feet.