Half of all the electricity consumed at one of the largest wastewater treatment facilities in the Midwest goes to running air blowers and pumps. That was the detail that stuck with me most from Saturday’s open house at the Terrence J. O’Brien Water Reclamation Plant at the corner of Howard Street and McCormick Boulevard in Skokie, one of seven facilities operated by the Metropolitan Water Reclamation District of Greater Chicago (MWRD).
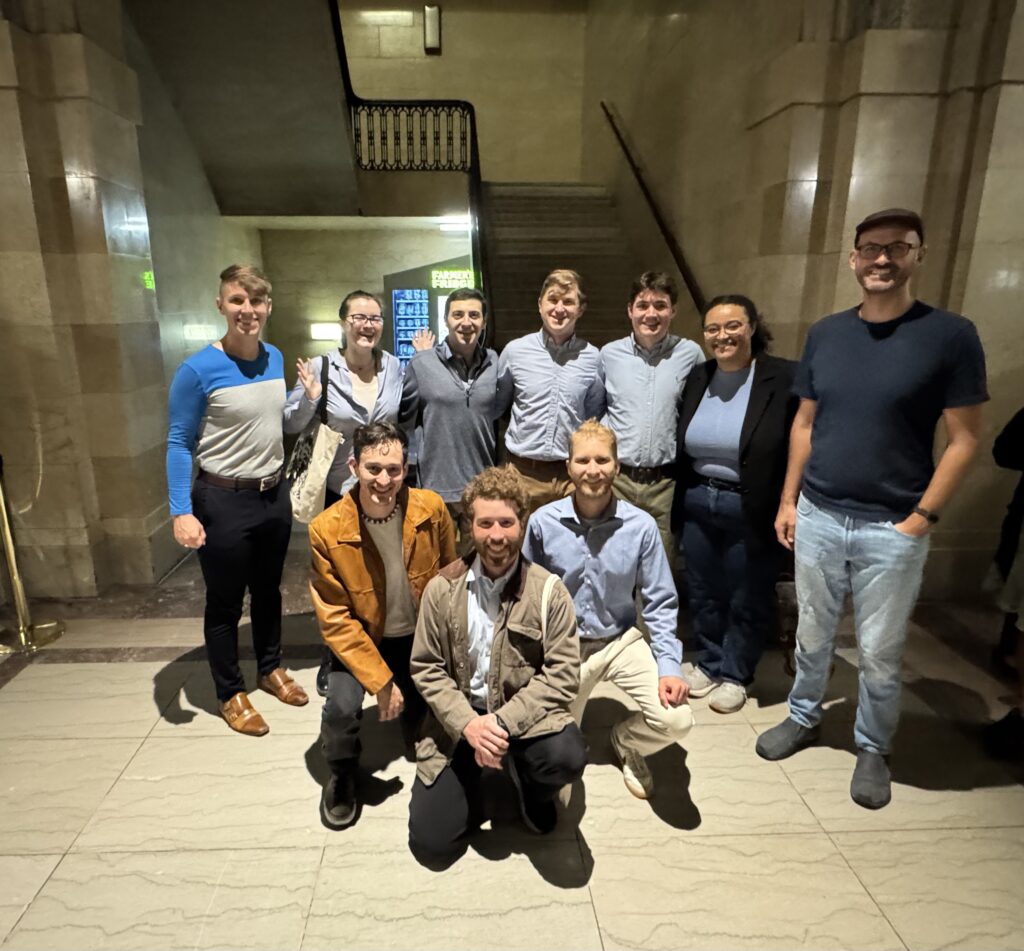
I visited with two friends; I think we left there with a clearer picture of the hidden machinery behind our region’s daily life.


A plant almost a century old
The O’Brien plant opened in October 1928. At the time, it was the largest sewage treatment facility in the world. Nearly a century later, it still serves over 1.3 million people across 143 square miles: Chicago north of Fullerton Avenue and 17 north suburban Cook County communities including Evanston, Skokie, Wilmette, Northbrook, and Glenview. Wastewater from all of those homes and businesses travels through a network of intercepting sewers beneath McCormick Boulevard before arriving at the plant’s 97-acre campus at Howard Street.

The plant was renamed for Terrence J. O’Brien, a longtime MWRD president who died in 2021. It’s one of seven plants in the district, each serving a distinct drainage area across the Chicago region.
Simpler than you’d think — and more remarkable for it
The treatment process is more straightforward than most people imagine. Incoming wastewater first passes through screens that remove large debris, then into settling tanks where solids drop out — capturing 60 to 80 percent of suspended material. After that, the water moves into aeration tanks where staff introduce what they affectionately call “bugs”: beneficial bacteria that consume the remaining organic matter. A final round of ultraviolet light disinfection kills any remaining pathogens before the treated water discharges into the North Shore Channel. This effluent is cleaner than the water in the channel.
That channel, built between 1907 and 1910, carries the plant’s effluent south toward the Chicago River — an engineered system designed to move water away from the lake and through the region. Because much of Chicago relies on combined sewers — single pipes carrying both stormwater and sewage — heavy rain events send a surge of combined flow toward the plant. It connects to TARP, the Deep Tunnel system, which captures and holds that overflow until the plant can process it. The plant handles an average of 230 million gallons per day, with surge capacity up to 450 million. At the time of our visit the plant had processed 156 million gallons.


Touring the plant
The MWRD ran an efficient open house, with guided tours departing every 15 minutes. Our guide was a retired staffer who came back to volunteer. Before working there for 10 years he worked at a suburban municipality’s drinking water plant.
A highlight was the 1926 Pump and Blower Building, a vaulted brick-and-steel industrial hall with a skylit roof that. Inside, massive blowers push air into the aeration tanks to keep the bacteria alive and working. Those machines account for roughly half the facility’s entire electricity consumption. It’s a staggering thought: hundreds of millions of gallons treated daily, and the biggest energy draw is simply moving some air.
We weren’t allowed into the grit chamber during the open house, but our guide noted that school groups regularly visit it — and that children almost universally react to the smell by pulling their shirts over their noses.
Infrastructure worth knowing
More people should understand how the infrastructure they pay for and benefit from actually works. The O’Brien open house is a rare chance to do exactly that: to stand next to the blowers, walk past the settling tanks, and talk to the people who run it. Staff talked to us about how they test at the plant and at businesses that generate “industrial wastewater”, including breweries and metal processing facilities.


The staff also test for viruses as well as fecal matter to assess the effluent’s cleanliness. The tour guide said that before the water enters the UV channels Before the UV channels the water has over 1,000 fecal coliform per 100 mL; after treatment it drops to 25, sometimes as low as 3. The MWRD’s NPDES permit sets the effluent limit at 200/100 mL as a 30-day geometric mean, so readings of 3–25 represent the plant performing well above the requirement.
The process is elegant in its logic, the history is genuinely impressive, and the scale is humbling. MWRD’s website does a better job than I at summarizing the process. The MWRD holds open houses at several of its water treatment plants each year. There are two more this month: